Learning Circle
Product Features
Learning Circle provides performance information to connect communities and classrooms to better serve each student.
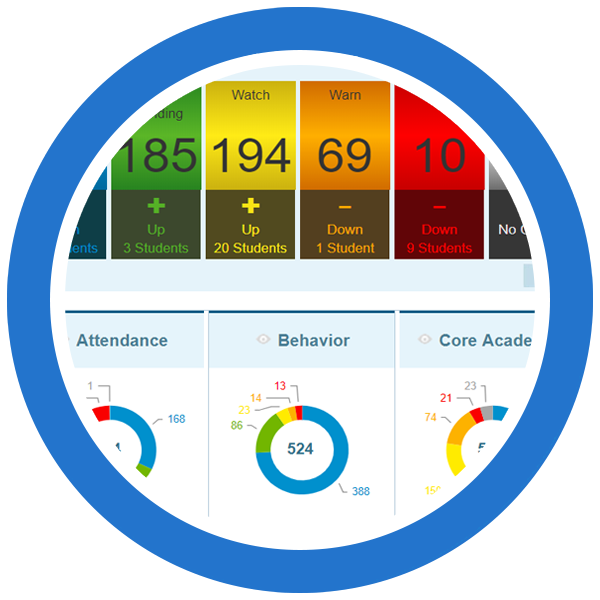
Learning Circle's Easy-to-Use Dashboards help Schools and Community Partners
- Schools and community organizations can view trends in attendance, behavior and core academics (ABCs) data over time.
- School staff can quickly see student involvement in both in-school and out-of-school programs.
- Community counselors and coordinators can analyze ABC data for the students involved in their programs.
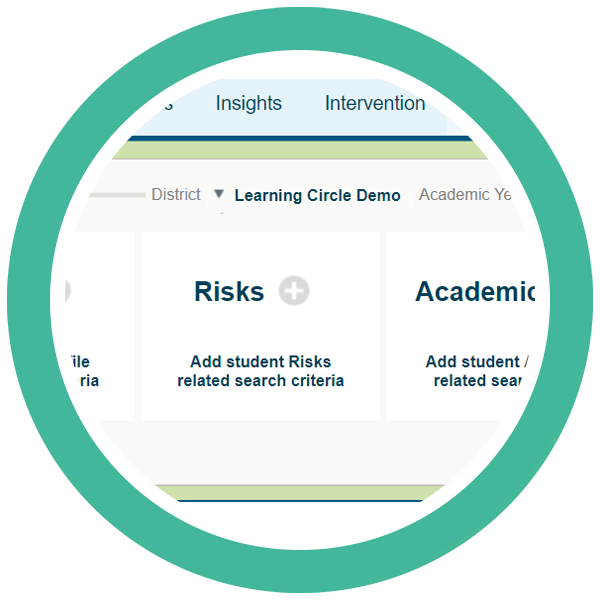
Use Filtering and Trends to Ensure All Student Populations are being Served
- Disaggregate information by race, ethnicity and gender to determine academic gaps.
- Ensure at-risk students are receiving the right strategies in school and community support.
- Gain immediate access to information on students recently enrolled in a school, district or community program.
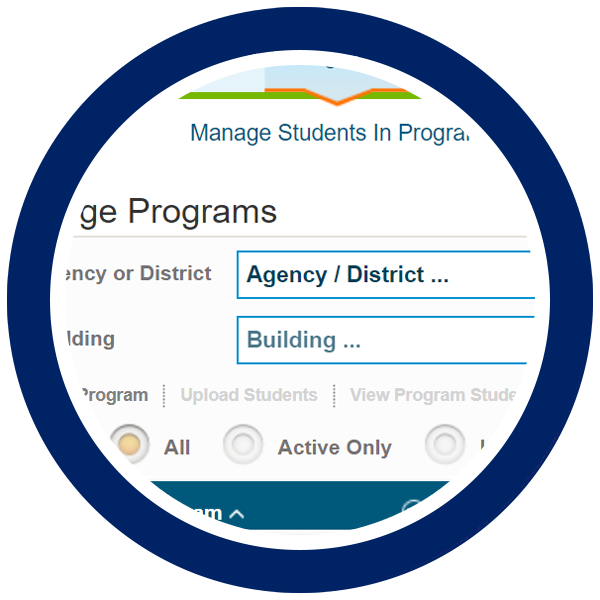
Use Programs Screens to Keep Track of Enrolled Students
- Program management allows community partners (with parental consent) to enroll their students for dashboard visibility.
- Program screen features allow for ease-of-use in managing student lists.
- Build a custom list of student you wish to monitor and use this list as a filter when needed.
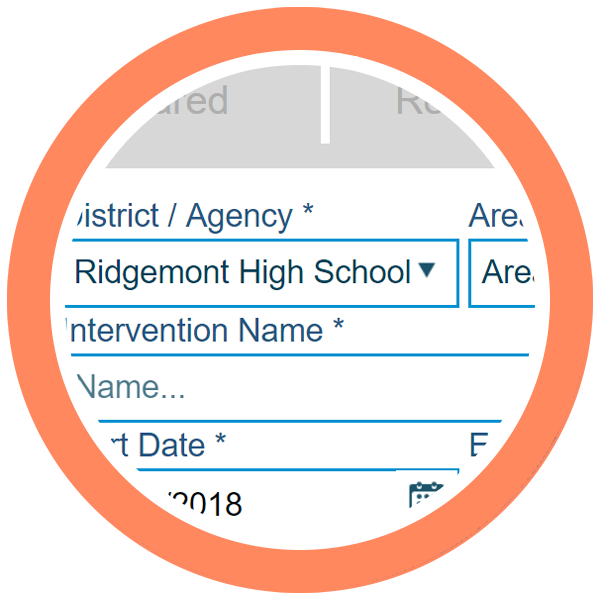
Create Interventions and Collaborate with Other School and Community Team Members
- Schools and community organizations have a common view of student data so they can communicate and collaborate on intervention strategies.
- Individual student dashboards mark intervention start and end date on performance trend graphs
- Easily see how attendance, behavior and core academics are being impacted by interventions.
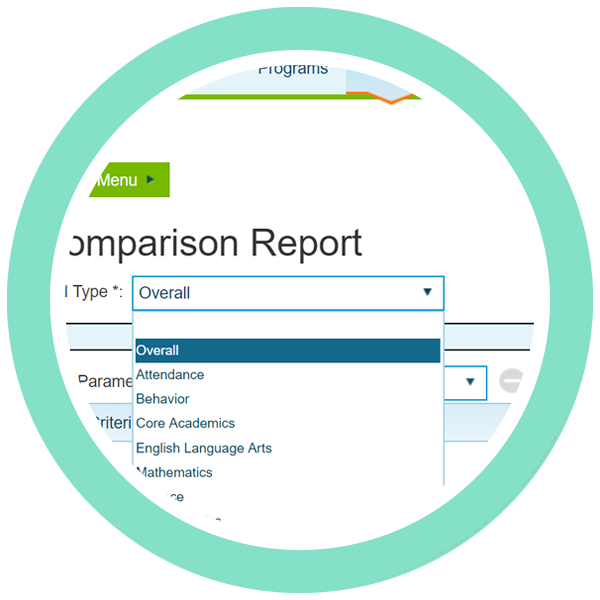
Create Comparison, Intervention, Program and Usage Reports
- Use comparison reports to measure performance outcomes of two distinct groups that you establish using filters.
- Easily compare outcomes by EWI type: Overall, attendance, behavior or core academics.
- Drill even deeper into core academics by analyzing English, math, science and social studies outcomes.